Data analytics is one of the hottest topics in drilling today. Corva provides a major opportunity for operators and drilling contractors to improve rate of penetration using powerful visualizations and easy-to-use recommendations.
Modern Analytics
Modern software analytics platforms have improved substantially over the last few years. The result is much easier means to analyze drilling rig sensor data and distill patterns to optimize ROP and improve operations. Not long ago teams would spend hours culling necessary data, but it now happens in seconds as automated software continuously works in the background – producing meaningful insight.
Drilling heatmaps provide the driller a bird’s-eye-view of optimal ROP and MSE.
Top Benefits of using heatmaps in your drilling operation:
1. Improve the speed at which you drill by reacting to formation, equipment, and system changes. ROP heatmaps provide a real-time method of finding the sweet spot as you drill. Deliver recommended operating ranges for WOB and RPM in order to achieve expected ROP results. Drillers get a quick way to visualize parameters using a green, yellow, red stoplight approach.
2. Powerful visualizations on how parameter changes in WOB/RPM affect ROP and MSE.
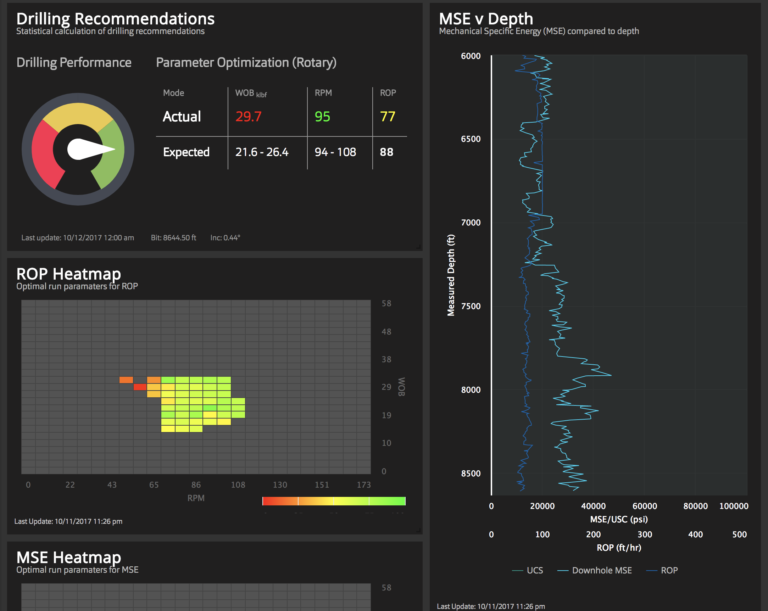
Image: MSE v Depth and Drilling Recommendations in the Corva v2 platform.
 Mar 19, 2024